
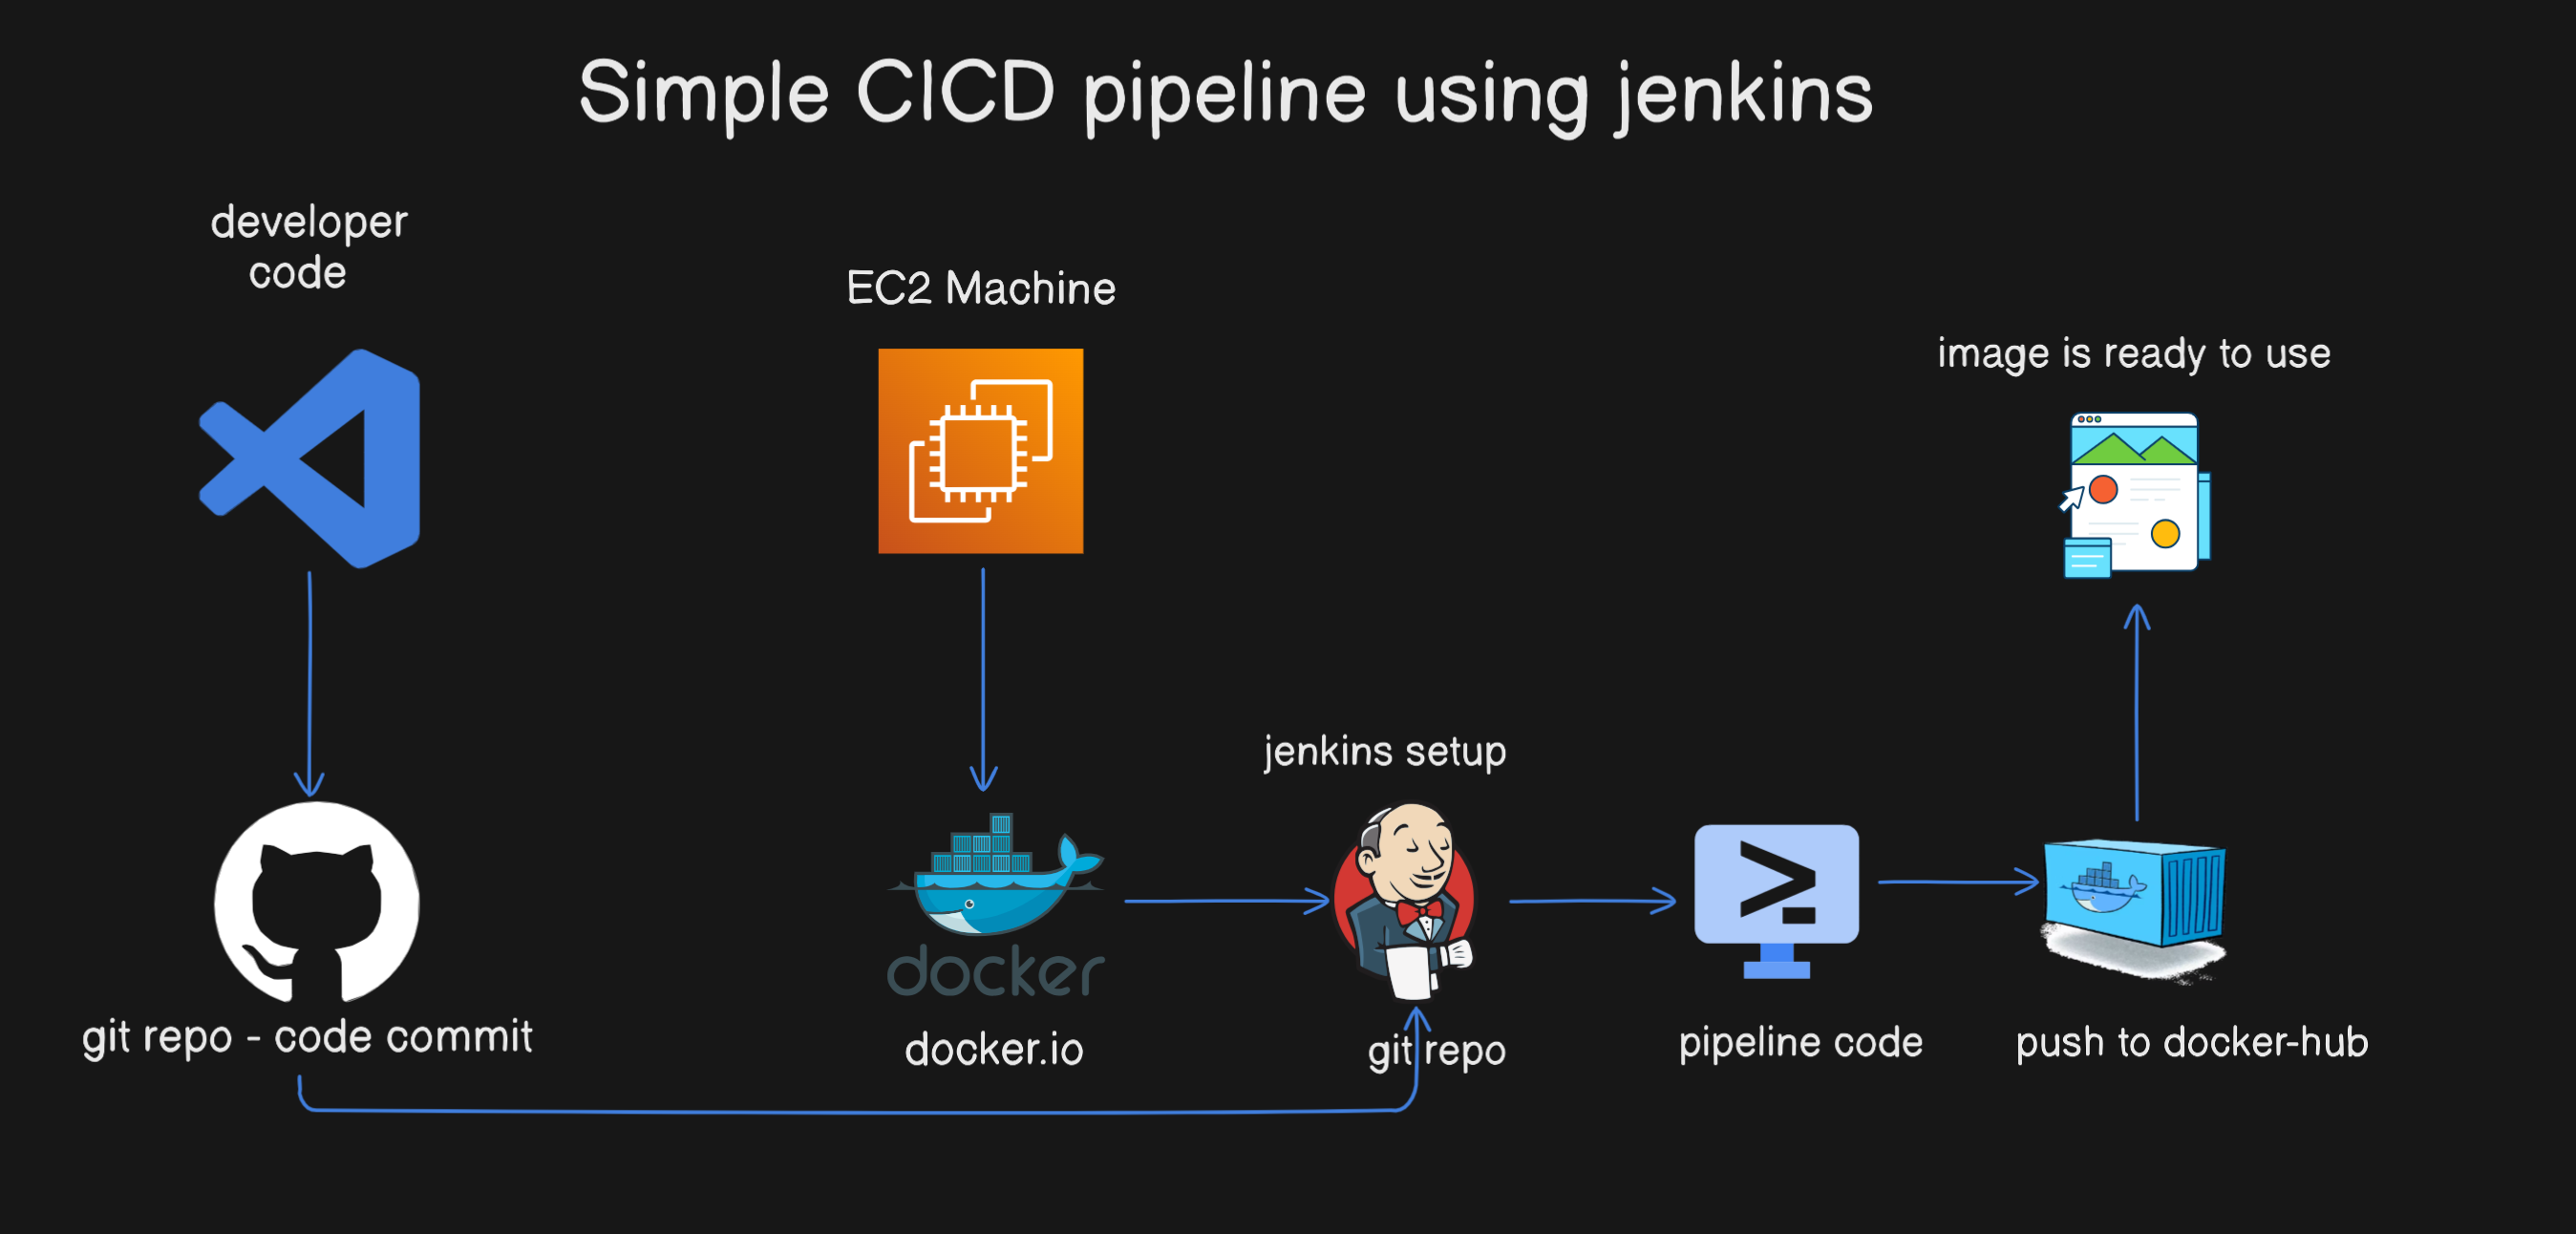
Simple CICD Pipeline Project – Todo Application
This is very basic CICD Pipeline Project for a ToDo Application. Follow the steps below to set up your Continuous Integration and Continuous Deployment pipeline.
Prerequisites
Ensure you have the following prerequisites before proceeding:
- EC2 Machine: Medium Size preferred. (4/GB RAM and 2 Core Processor)
- Docker Setup on EC2 Machine.
- Jenkins Setup: You can either manually install Jenkins or use a Jenkins image.
- GitHub Account: You need a GitHub account to automate the pipeline.
For more updates and projects, visit:
Architecture Diagram

Step 01 - Create EC2 Machine


Step 02 - Connect EC2 Machine
Connect to your EC2 Ubuntu Machine using SSH. Make sure you're in the root user or use 'sudo'.
$ sudo ssh -i "key.pem" ubuntu@<ip-address>
Step 03 - Install Docker on EC2 Machine
Install Docker on your EC2 machine. Use the following commands:
Set up Docker's apt repository.
$ sudo apt-get update

$ sudo apt-get install ca-certificates curl

$ sudo install -m 0755 -d /etc/apt/keyrings

$ sudo curl -fsSL https://download.docker.com/linux/ubuntu/gpg -o /etc/apt/keyrings/docker.asc

$ sudo chmod a+r /etc/apt/keyrings/docker.asc

$ echo \

  "deb [arch=$(dpkg --print-architecture) signed-by=/etc/apt/keyrings/docker.asc] https://download.docker.com/linux/ubuntu \

  $(. /etc/os-release && echo "$VERSION_CODENAME") stable" | \

  sudo tee /etc/apt/sources.list.d/docker.list > /dev/null

$ sudo apt-get update
# Install Docker packages.

$ sudo apt-get install docker-ce docker-ce-cli containerd.io docker-buildx-plugin docker-compose-plugin

Step 04 - Installation of Jenkins
Install Jenkins either manually or using container-based installation. Here's the container-based installation command:
$ docker run -p 8080:8080 -p 50000:50000 -d \

-v jenkins_home:/var/jenkins_home \

-v /var/run/docker.sock:/var/run/docker.sock \

-v $(which docker):/usr/bin/docker jenkins/jenkins:lts
After running the above command, Jenkins container will be created and started. Access Jenkins using the IP address of your EC2 machine followed by port 8080.

Now you can type blow ip address if your ec2 machine and check whether your Jenkins is accessible or not But make sure that the port should be added on your EC2 Security Group


$ localhost:8080
$ <ip-address>:porty

Now, In order to get the jenkins password. you have to login or access the jenkins container
$ docker exec -it <container-id> bash
$ docker exec -it 98760878abree bash

Step 04 - Jenkins Pipeline Setup
Now that we have setup our EC2 server, Docker, and Jenkins, let's create a simple Jenkins pipeline.
Before creating the pipeline, ensure your Git repository is up to date. Use the following links to update:
Log in to Jenkins using the password generated during setup.

Choose 'Pipeline' and 'Pipeline Script from SCM', using the Jenkinsfile provided in your Git repository. 


After setting up the pipleline and connected to git repo. now lets test the below code and see your our pipeline works or not
First create the Jenkinsfile in your git repo and add the below code in Jenkinsfile
pipeline {

    agent any

    stages {

        stage("Code checkout") {

            steps {

               git branch: 'main', credentialsId: 'github-id', url: 'https://github.com/waseemuddin/simple-cicd-project01.git'

            }

        }

    }

}
Now Jenkinsfile has been updated. Goto pileline and press the "Build Now" to check the pipeline fetch git repo and shows the stage view.


Step 05 - Jenkins Set Webhook - Automate the Pipeline Process
To automate the Jenkins pipeline, we'll set up a Git webhook. Navigate to your repository settings and add a webhook with the Jenkins server's IP and port.

Step 06 - Final Step - Run Complete Code
In the final step, we create a complete pipeline from code checkout to container creation.
The updated code is available in the Jenkinsfile. Ensure you have an empty repository on your Docker Hub account for image storage.
pipeline {

    agent any
    stages {

        stage("Code checkout") {  # Git Repo Check-out Step

            steps {

               git branch: 'main', credentialsId: 'github-id', url: 'https://github.com/waseemuddin/simple-cicd-project01.git'

            }

        }

        stage("image build") {  # Image Build Step and make sure you have to create the empty repository on your Docker-Hub Account

            steps {

                sh 'docker image build -t waseem63/mydockerapp:v$BUILD_ID .'

                sh 'docker image tag waseem63/mydockerapp:v$BUILD_ID waseem63/mydockerapp:latest'

            }

        }

        stage("Image Push") {  # Image Push Step and connect to your docker-hub account. Also remove the image so the storage can be maintain

            steps {

                withCredentials([usernamePassword(credentialsId: 'docker-hub-id', passwordVariable: 'PASS', usernameVariable: 'USER')]) {
                    sh "echo $PASS | docker login -u $USER --password-stdin"

                    sh 'docker push waseem63/mydockerapp:v$BUILD_ID'

                    sh 'docker push waseem63/mydockerapp:latest'

                    sh 'docker rmi waseem63/mydockerapp:v$BUILD_ID  waseem63/mydockerapp:latest'

                }

            }
        }

        stage("Container Creating") { # last step is to fetch the lastet or recent image and create docker container automatically.

            steps {

                sh 'docker run -itd --name todoapp -p 3000:3000 waseem63/mydockerapp:latest'
            }

        }
    }

}

Now, any push to the repository will trigger the Jenkins pipeline automatically.
Congratulations! You have successfully set up a CI/CD pipeline for your Todo Application.
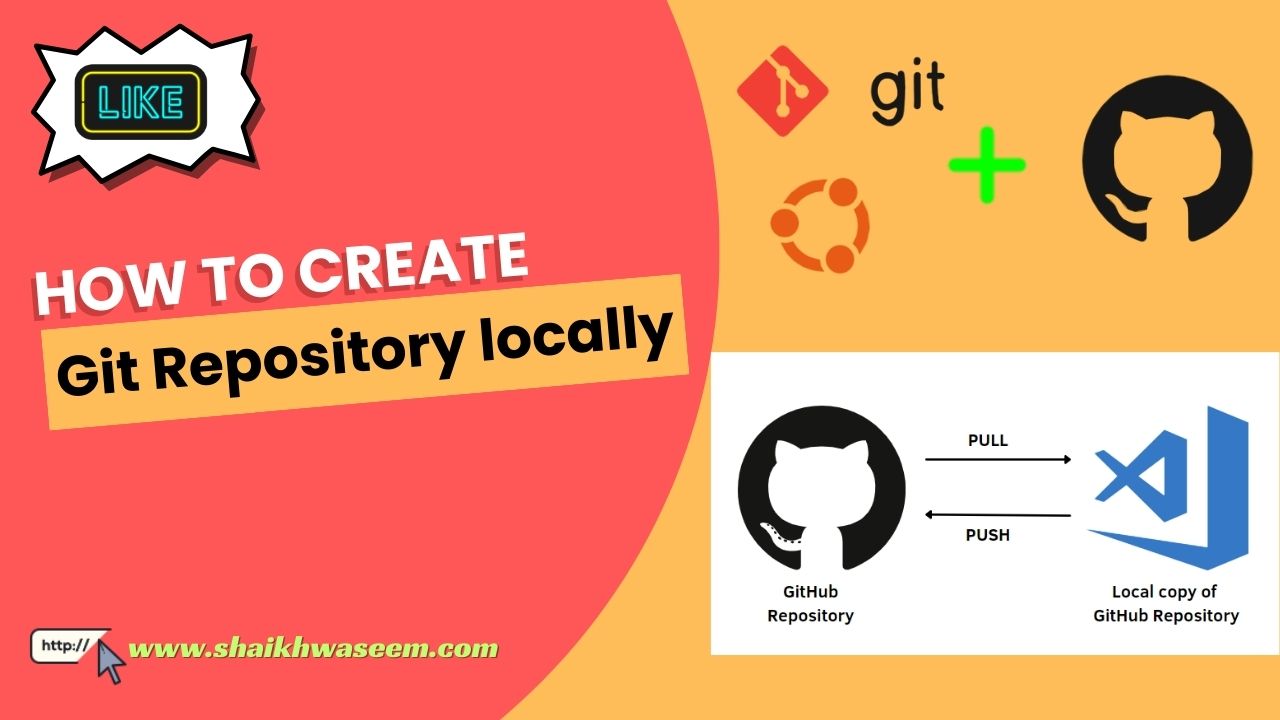
Create Your First Git Repository And Push to GitHub Account
Create Your First Git Repository And Push to GitHub Account
GitHub is a popular platform for hosting and collaborating on code repositories. Whether you are new to coding or an experienced developer, knowing how to create a repository and push your code to GitHub is a crucial skill.
In this step-by-step Lab, I will guide you through the process of creating your first GitHub repository and pushing your code to your GitHub Account. By the end of this Lab, you will have the necessary skills to get started with version control, code hosting, and collaboration on GitHub. I will try my best to cover topics such as GitHub basics, repository creation, and pushing code to GitHub.
Youtube Video: https://youtu.be/pHLb3GMyNhI
GitHub Repo :https://github.com/waseemuddin/Git-for-beginners.git


$ mkdir Git-for-begineers

$ cd Git-for-begineers

$ git status
$ mkdir imges

$ mkdir js

$ mkdir css

$ mkdir project

$ touch css/front.css

$ touch js/mysim.js

$ touch index.php$ git init
$ git status
$ git add .
$ git commit


Our local repository files are commited and now its time to push into remote repository

To push your code to remote repository, first you have to create the empty reposity on your github account
Got your github accunt profile and create new repository


Now its time to push your local repository to your remote repository means your Github account


As you see all local repository files/folders are now push to remote repository

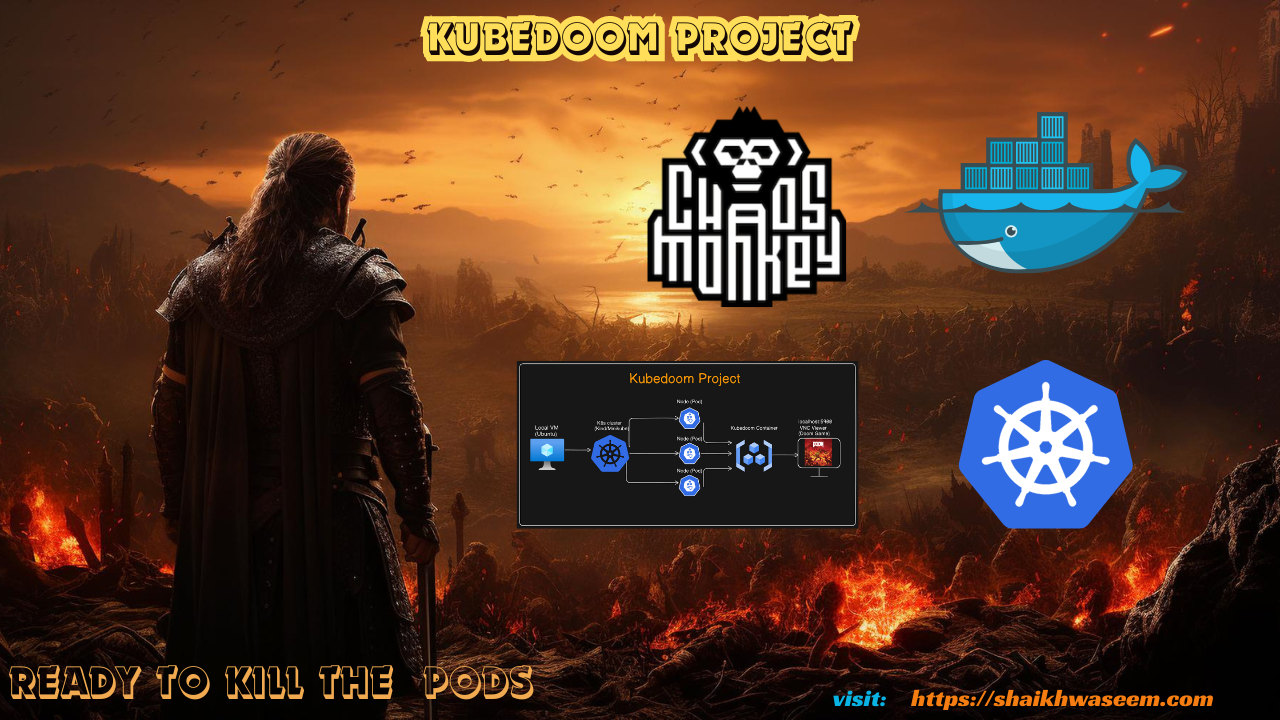
Kubedoom DevOps Project
Kube DOOM Project for Kubernetes learning purposes
Kill Kubernetes pods using Id's Doom!
The next level of chaos engineering is here! Kill pods inside your Kubernetes cluster by shooting them in Doom!
Youtube Video: https://youtu.be/pHLb3GMyNhI
GitHub Repo : https://github.com/waseemuddin/kubedoom-project-devops
This repo contains about the Kube Doom project for learning and implementing the Kubernetes and killing the pods inside your kubernetes cluster.
The credit goes to iiDKx & storax/kubedoom.
The following steps are involved to implement the KubeDoom Project
Prerequisites
This is project can be implemented on your local machine (VM), AWS Cloud or any other cloud provider which suites you.
- Local Machine(VM) (Ubuntu 22.04)
- Docker Installation link
- Kind or Minikube or kubeadm Installation. (Install Kind quickly with:
./install-prereqs.sh) - TigerVNC Viewer


Step 1: Update VM/Ubuntu
After installation of VM (ubuntu), please make sure your sytstem is updated
#Basic command to make sure all are update

sudo apt update

sudo apt-get update

#Check IP

ifconfig

ip --brief addr show

#Check firewall

sudo ufw status

sudo ufw allow 22/tcp

#swapoff

sudo -i

swapoff - a
Step 2: Steup Kubernetes Cluster (Kind)
Running Kubedoom inside Kubernetes
Install kind master and worker node
See the example in the /manifest directory. You can quickly test it using kind. Create a cluster with the example config from this repository:
$ kind create cluster --config kind-config.yaml

Creating cluster "kind" ...

 ✓ Ensuring node image (kindest/node:v1.25.3) 🖼

 ✓ Preparing nodes 📦 📦

 ✓ Writing configuration 📜

 ✓ Starting control-plane 🕹️

 ✓ Installing CNI 🔌

 ✓ Installing StorageClass 💾

 ✓ Joining worker nodes 🚜

Set kubectl context to "kind-kind"

You can now use your cluster with:
kubectl cluster-info --context kind-kind

Not sure what to do next? 😅  Check out https://kind.sigs.k8s.io/docs/user/quick-start/

Set your Kube context with: kubectl cluster-info --context kind-kind
This will spin up a 2 node cluster inside docker, with port 5900 exposed from the worker node. Then run kubedoom inside the cluster by applying the manifest provided in this repository. The Kubernetes-Manifests-Files directory holds Kubernetes manifests for deploying your application on cluster.
$ kubectl apply -k manifest/

namespace/kubedoom created

deployment.apps/kubedoom created

serviceaccount/kubedoom created

clusterrolebinding.rbac.authorization.k8s.io/kubedoom created
Step 3: Docker Build
Build the image with docker build --build-arg=TARGETARCH=amd64 . -t kubedoom while in this directory. Then run:

#docker run command and and attached pods

$ docker run -p5801:5800 \

  -e NAMESPACE=default \

  --net=host \

  -v ~/.kube:/root/.kube \

  --rm -it --name kubedoom \

  kubedoom:latest
Optionally, if you set -e NAMESPACE={your namespace} you can limit Kubedoom to deleting pods in a single namespace

Step 4: Docker Build
Deploy some Nginx pods to your cluster:
kubectl apply -f k8s/nginx-deployment.yaml
You can refresh the dashboard as you kill the pods from Kubedoom and expand upon this to track other metrics and applications in your cluster.

Step 5: Attaching a VNC Client
Now start a VNC viewer and connect to localhost:5900. The password is idbehold:
$ vncviewer viewer localhost:5901You should now see DOOM! Now if you want to get the job done quickly enter the cheat idspispopd and walk through the wall on your right. You should be greeted by your pods as little pink monsters. Press CTRL to fire. If the pistol is not your thing, cheat with idkfa and press 5 for a nice surprise. Pause the game with ESC. iddqd for god mode.
Cheat codes found here: https://doom.fandom.com/wiki/Doom_Cheat_Codes


To connect run:
$ vncviewer viewer localhost:5900
Step 6: Kubedoom demo

Create a dashboard in Grafana to monitor the Nginx containers. To do this open Grafana at http://localhost:3000 and login. Make sure you have your data source set to your Prometheus pod from the previous step. From the left hand menu, create a new dashboard and add a panel. Select the panels dropdown menu, select Inspect and then select Panel JSON. Here you will be able to delete the current JSON and replace it with JSON from the grafana folder ./grafana/nginx-panel.json. Save and apply this and you should be able to see the CPU usage of the current deployed pods.
Step 7: Deploying Prometheus
Create a monitoring namespace to keep things tidy.
kubectl create namespace monitoring
Deploy Prometheus to scrape and store metrics for your cluster with:
kubectl apply -f k8s/prometheus.yaml -n monitoring
List the Prometheus pod name and IP address.
$ kubectl get pods -o wide -n monitoring

NAME                                     READY   STATUS    RESTARTS      AGE   IP           NODE          NOMINATED NODE   READINESS GATES

prometheus-deployment-75cff7d89f-w422q   1/1     Running   1 (15m ago)   25m   10.244.1.3   kind-worker   <none>           <none>
In a separate terminal run the below command to port-forward and you'll be able to access Prometheus on http://localhost:8080:
kubectl port-forward -n monitoring prometheus-deployment-75cff7d89f-w422q 8080:9090
To run in background:
kubectl port-forward -n monitoring prometheus-deployment-75cff7d89f-w422q 8080:9090 &
Prometheus graph display command.
rate(container_cpu_usage_seconds_total{namespace="default", container="nginx"}[30s]) * 100
Step 8: Deploying Grafana
Deploy Grafana to graph our metrics from Prometheus with:
kubectl apply -f k8s/grafana.yaml -n monitoring
In another terminal, list the pod names and port-forward from one of the pods:
$ kubectl get pods -n monitoring

NAME                                     READY   STATUS    RESTARTS      AGE

grafana-5469c64c7d-ddz4r                 1/1     Running   1 (20m ago)   30m

grafana-5469c64c7d-xdlmw                 1/1     Running   1 (20m ago)   30m

prometheus-deployment-75cff7d89f-w422q   1/1     Running   1 (20m ago)   30m
$ kubectl port-forward -n monitoring grafana-5469c64c7d-ddz4r 3000

Forwarding from 127.0.0.1:3000 -> 3000

Forwarding from [::1]:3000 -> 3000
Grafana should now be reachable at http://localhost:3000.
Log in with username admin and password admin.
Once you are logged in, you will need to go to the Settings (gear icon bottom left) and edit the Data sources.
Change the URL in the settings from http://prometheus-service.monitoring.svc:8080 to http://<Prometheus Pod IP>:9090. Use the below command to get the Prometheus pod IP.
$ kubectl get pods -o wide -n monitoring

NAME                                     READY   STATUS    RESTARTS      AGE   IP           NODE          NOMINATED NODE   READINESS GATES

prometheus-deployment-75cff7d89f-w422q   1/1     Running   1 (15m ago)   25m   10.244.1.3   kind-worker   <none>           <none>
So I would enter http://10.244.1.3:9090 as my data source. Save and test this.
Kubedoom requires a service account with permissions to list all pods and delete them and uses kubectl 1.25.3.
Running Locally
In order to run locally you will need to
- Run the kubedoom container
- Attach a VNC client to the appropriate port (5901)
With Podman
Run kubedoom:latest with podman locally:
$ podman run -it -p5901:5900/tcp \

  -v ~/.kube:/tmp/.kube --security-opt label=disable \

  --env "KUBECONFIG=/tmp/.kube/config" --name kubedoom

  kubedoom:latest
Killing namespaces
Kubedoom now also supports killing namespaces in case you have too many of them. Simply set the -mode flag to namespaces:
$ docker run -p5901:5900 \

  --net=host \

  -v ~/.kube:/root/.kube \

  --rm -it --name kubedoom \

  kubedoom:latest \

  -mode namespaces
Building Kubedoom
The repository contains a Dockerfile to build the kubedoom image. You have to specify your systems architecture as the TARGETARCH build argument. For example amd64 or arm64.
$ docker build --build-arg=TARGETARCH=amd64 -t kubedoom .To change the default VNC password, use --build-arg=VNCPASSWORD=differentpw.